Pages

Tuesday, June 10, 2014

World Cup Map

As you cannot ignore the World Cup returns this year and its 2014 edition starts in a few days.
This year it is in Brazil, arguably the most passionate country about this sport, and factually the most titled.

Usually a festive event, Brazilians, with their uncanny talent for celebration, will surely try their best to make a pulsing, gigantic, once-in-a-generation carnival out of it.

On such special occasions, it is customary to deviate a bit from your day to day work and kind of participate in the event in your own way. We launched an online betting game - without real money, only prizes for those who end up with the most tokens.

It is corporate so here I can only show the World Cup map I contributed.
The full code is available in this github repo.

By the way this was my first experiment with Web Components. Very convenient !

Enjoy the World Cup !!

Tuesday, April 29, 2014

Texas Hold'em Hand Evaluator - The return

I knew I would do it.
Finally I rewrote my exploration of the game in Python (including jit numba accelerated parts) and Javascript. As powerful as Mathematica is, I wanted to put it on the open web.

The post is an IPython notebook in its html form including d3.js animations.
The full code and data (tables) are available in this github repo.


Sunday, December 29, 2013

VIX futures market

The VIX is the ticker for the Chicago Board Options Exchange Market Volatility Index, which measures the level of 1-month implied (i.e. anticipated by the market) volatility in the S&P 500. It is constructed from a wide range of S&P 500 listed call and put options.
The exact definition is in this paper pages 3-9.

Below is a historical graph of the VIX since December 2006.

Saturday, December 28, 2013

The Power of Visualisation


Let us first quote Wikepedia verbatim:
'The adage "A picture is worth a thousand words" refers to the notion that a complex idea can be conveyed with just a single still image. It also aptly characterizes one of the main goals of visualization, namely making it possible to absorb large amounts of data quickly.'
Now let us make some slight amendments:
  • append 'or dynamic interactive images' to the first sentence.
  • append 'or grasp complex notions almost instantly' to the last sentence.
You then have the updated definition of the power of visualization. There is nothing conceptually new here, of course.
Charles Minard made his famous flow chart of Napoleon's disastrous Russian campaign in 1869 (see below). In a sweeping look, you can see the number of men as the armies advance, the main cities on their path, the rivers they go through, and the dates and the deadly temperature on they way back, all at once.


It is proof of how the potential of visualisation was already understood as far back as in the 19th century. Incidentally, this map is a also a memorable representation of the abyss leadership's hubris can lead to.

Saturday, March 9, 2013

Photo Cube

In my exploration of the various javascript libraries, I ran into three.js. It enables the user to do 3D in the browser without going into the complex underlying math.

I found it well conceived. Its structure is relatively easy to grasp and the syntax is usually self explanatory. As a result, somebody with very little experience in javascript/programming, like me, can create reasonably good looking effects in a few hours. You just have to define a scene, a camera, some objects (cubes, spheres, etc), and a renderer (WebGL, Canvas, SVG - the best option, if available is WebGL, as computations are performed by the GPU). By default the camera faces the (xy) plane, the x axis x being horizontal pointing right and y vertical pointing up. The z axis is orthogonal to the screen pointing to the viewer. Axes and a 'test' small sphere are convenient to get orientated.

For some time, I had being looking to do a photo cube, so that the experience of going through the pictures is less boring.

With this in mind, I dived into three.js, googled around and found some very useful pages:


Below is the result.
The 'drag to spin the cube' works on an iPad too.


The code is available in this github repo.
You can easily tweak the point of view, distance of the camera, angle of view, amongst others.
And the pictures, of course ! I just put what I like as an example 


Friday, February 15, 2013

Map of France

When I was a kid, every summer, we used to drive across the country to the summer family house where we would stay for a month, or two. The school summer holidays were and are still very long.

At the moment the debate about school weekly timetable is raging in France. The government wants to reduce the amount of class time during the school day and add an additional half-day on Wednesday. France has the shortest school year and the longest school days of Europe. Such daily long hours on one hand, and long idle summer months on the other, make a very peculiar weekly and yearly rhythm. Needless to say this situation is not favorable to learning, particularly among less gifted children.

As most social equilibria in France, it is the result of a balance of power between several entrenched corporations, teachers, unions, formerly the Church (which negotiated a day dedicated to religious instruction after public school took over from it in the late 19th century), but obviously not children..

While the status quo is clearly bad for eduction, while the performance of French pupils/students is said to deteriorate relative to those of other industrialized countries (I have cannot quote the source but by all accounts of the teachers that I know the level of the average student has fallen dramatically), while the country is less and less industrialized, while speaking fluent English remains unusual, while the impact of school in the creation of citizens is eroding and its prestige has almost disappeared, it should be urgent and a no brainer to try and act quickly and boldly.

Germany for example is an interesting model. Pupils/students spend significantly less time at school, but their weekly time table is more evenly spread, they have more time to extra scholar activities (sports, music, etc), their summer holidays are much shorter, and their are better on the PISA scale. Such a ranking is always subject to interpretation, so one should not over interprete it. But then isn't Germany's economy and industry doing well ? Isn't our neighbor comfortably more wealthy ? It couldn't if its education system was that bad. So we could get some inspiration from them.

But surprisingly the individual interests of the teachers and some parents who want a convenient timetable for themselves prevails. The strikes are massive, the teachers vehemently oppose the reform, and the government shall step back, as always, whether right wing or left wing. There seems to be little sense of the public good, even among civil servants, and for sure hardly any notion of long term, in the corporations organising these demonstrations. I have not studied the proposal in detail, but I am aghast at the systematic blocking behavior of these corporations, and the power they derive from their control of the streets, outside any democratic process.

Thursday, February 7, 2013

From Vedutismo to Mandelbrot Fractals

Last month, I went to see the Vedutismo (In Italian veduta means view) exhibition in Musée André-Jacquemard, with a few friends.

The Vedutismo is the 18th century school of painters who specialised  in scenes of daily life in Italian cities and mainly Venice.

The first maestro was Canaletto, who immortalized the various faces of the Venice of his time. He had perfectly mastered the technique of perspective, and used a camera obscura to create the layout his canvases. His paintings are impressive for their architectural and geometrical accuracy and great attention to brilliant details. They are often bathed in sunlight.

The second great painter of the exhibition, Guardi, was influenced by Canaletto in his early years, but gradually evolved to a less linear, sort of impressionist style. The scenes tend to be less glamorous, the waters are murkier, and the skies cloudy. But despite this looser painting style, the geometry and perspective are faultless.

Enough words, here are the canvases, two from each.
Can you recognize who painted what without reading the captions ?


Piazza San Marco - Canaletto

Sunday, January 13, 2013

Ball in gravity and air drag

My sister in law is an intelligent fine young woman, and a high school teacher, living in France.

Over the last 2 years,  traditional education in the US has been seriously shaken by the sudden and massive popularity of online courses, as the coming of age of web technologies has made them possible for teachers and pleasant for students.

The breakthrough came from Salman Khan who founded the now famous (and fantastically useful ! - not just to students) Khan Academy. The first unsolicited feedback he got from his youtube viewers say a lot about the depth of the demand for good quality education/instruction. In hindsight, it need not be that big a surprise, as the irrepressible urge to know/learn/discover is quintessentially human, particularly among young people. After all wikipedia, another spectacular success driven by people's appetite for knowledge, had already surpassed centuries old institutions like the Encyclopedia Britannica. And his extraordinary success, signalled by a Forbes' cover page, is all the more noticeable than his endeavor is not-for-profit.

At university level, the first foray into MOOC (massively open online courses) came from, I believe, Stanford's professors Sebastian Thrun and Peter Norvig with they Artificial Intelligence class in the last quarter of 2011. Surprised by the number of applicants (more than 50,000 !), and impressed by the potential impact, they founded Udacity. Many universities have quickly followed suit and soon after founded Coursera, which aggregates online courses from many universities, and edX, created by Harvard and Berkeley. Everybody clearly feels the trend and jockeys hard to capture audiences.

Sunday, January 6, 2013

Pythagorean Theorem

In the first weeks of December, as I was thinking of acceptable Christmas presents for my friends/family. Strolling in department stores, I caught a glimpse a tablet - not an iPad/Android like tablet, but  - a drawing tablet ! I was convinced instantly. Then I dug into the realm of Wacom/Bamboo products and soon was completely carried away by the potential of such devices. Soon after I had bought and was testing it.

It is a great potential replacement of a mouse, absolutely fantastic for drawing, and a tool of choice to do Khan Academy's style video tutorials.
As a drawing soft, Sketchbook Express, available on the Mac App Store, is convenient: free, simple, beautiful.

Pleased by my new device, I started off recording (in French) a few tutorials, as a first exercises. The screen capture soft used is Snagit (Camtasia is even better with additional editing features).

Below is the simplest demonstration of the Pythagorean theorem, in my view, as the only thing you need to know are the formulae for the area of a square, and a right triangle. Not Thales/Cos/Sin/etc.

It is not a pedagogical master piece but relatively decent for a first trial, which says a lot, again, about the potential of drawing tablets+video screen capture as means to convey relatively complex messages.


The shopping season proved quite interesting..
I kept my tablet and offered two.


Tuesday, January 1, 2013

Deutschland, Bundesländer - Karte

Recently I have been experimenting with the impressively well thought and powerful d3.js javascript library. The capabilities of the library are jaw dropping and the quality of the rendering, on some examples is quite amazing, and the idea to have built it directly on top of the web standards is simply brilliant. This last design decision is so powerful that this library stands a chance to become a standard itself.

In practise I am also learning the basics of HTML+CSS+Javascript, so in order to be able to make some d3 data visualisation, I am forced to sometimes long digressions..

It is to be noted that the d3.js learning curve is quite steep, in spite of several very good quality tutorials available. The first one I read was written by Scott Murray. Very good.

Below a dynamic map of the 16 federal states that make Germany, designed to help me learn them (on top of helping me learn d3.js).
The code is available on bl.ocks.org/4423770.

Thursday, December 27, 2012

Heart-shaped Watt's curve

In some parts of Europe, you can find sensible, pragmatic governments which hold long term views about where their future prosperity may lie, while the area is going through a severe crisis and tough international - I should be more specific, intercontinental - competition threatens Europe's long term wealth, quite often implicitly taken for granted... This seems to be the case in France where the political class (overwhelmingly foreign to any sort of business) and the media fill the airwaves and the internet fibers with a discourse very often quite disconnected from reality. I sometimes wonder how so much individual talent and imagination and inspiration can aggregate to such a poor, short-sighted, conventional, boring public debate.. But I digress !..

So, some governments want to attract more young girls to a science/engineering curriculum, because they think that half of the population should take part, and shape tomorrow's industries.

My tiny contribution towards this (I believe sensible) goal is the following Watt's curve, which I designed so that it resembles an enticing heart  


The curve is defined in the complex plane. With Wikipedia notations, it the heart-shaped Watt's curve polar equation is:
\[{ r }^{ 2 }={ b }^{ 2 }-\left[ asin\theta +\sqrt { { c }^{ 2 }-{ a }^{ 2 }{ cos }^{ 2 }\theta } \right] \]
with
\[a=0.48\quad b=1\quad c=0.5\]

Most will probably find it cheesy. Some may even find it sexist. But I insist I meant no harm, just a small delicacy.

The Mathematica code to create this animated gif is in this github repo.

Monday, November 26, 2012

Sun Motion 3: Analemma


Equation of time and location

In the previous post, the equation of time is derived from the angle difference from the mean sun to the true sun, after projection of the true sun on the equator plane. This angle is then converted to a time difference by proportion with the (constant) Earth's rotation speed.

The equation of time is based on the position of the true sun on the celestial sphere, which is independent of the observer's location on Earth. The equation of time is the same irrespective of the position of the observer. So knowing the equation of time, an observer knows when to look up and record the altitude of the sun, and subsequently deducts the latitude of his location.

But reversing the problem, if an observer looks up at 12:00pm sharp, the azimuth of the sun (in local coordinates) may vary significantly depending on his latitude. So if you define the analemma as the position of the sun (azimuth, altitude) in the sky at 12:00pm every day of the year, you expect significantly different aspects for different latitudes.

Below I have plotted the analemma for a number of locations (only the latitude matters), taking into account the obliquity and eccentricity of the Earth's orbit, and using the (quite precise) Gregorian duration of the year (365.2425 days), going through 366 days from 20mar12 (included) to 20mar13 (included), the 2012 spring equinox being 20mar12 05h14mn, and the perihelion date being 2jan13 04h38mn.

Note that there is a slight difference between the position of the sun on the 20mar12 and 20mar13. This is due to the extra 0.2425 day (beyond 365) in the duration of the year. This offset would grow from 2013 to 2015, and then return to almost zero on 20mar2016, because 2016 is a leap year.

Why almost ?
Because (i) the duration of the year is not exactly 365.25 but 365.2425, and (ii) even beyond Gregorian calendar precision, there are second/third order influences on the duration of the year:
There are a number of small order variations. It is difficult to understand more than basic concepts about them and even more to put them in perspective as they have very different periods. This short video from the Casssiopeia project is an excellent tutorial. Anyway, in the long run, the Earth orbit, and consequently duration of the year, is chaotic, meaning it cannot be accurately predicted a long in time in advance (here, say some million years). The smallest (inevitable) measurement error would become a prevailing factor in the long run.
All this can safely be and is neglected here.


Friday, November 23, 2012

Sun Motion 2: Equation of Time

Have you ever heard of the 'Equation of Time' ?
I had not until I came across a Wikipedia article about it while I was reading some stuff with respect to my previous post. I loved the words: The 'Equation of Time' sounds biblical, like a formula containing a precious secret of the Universe handed over by God to Man. The first men who discovered it must have considered it divine !

But what is it ?

If I am like my fellow citizens, few people have even heard about it, as today, and by and large since the beginning of the 20th century, we rely on man made mechanical clocks, as opposed to derive the hour from the position of the sun in the sky.

The equation of time is the measurement of the time difference between the time given by a sundial and a mechanical clock. You have always been told that the sun is exactly South at solar 12:00pm (which may be different from civil 12:00pm; in France for example, civil time is solar time+1h in autumn winter and solar time+2h in spring/summer) but this is generally not correct at your clock 12:00pm.

In order to visualize why, let us imagine an individual standing on the Equator, equipped with a reliable watch. Every day of the year, that individual looks up at 12:00pm and records the position of the position of the sun, azimuth and altitude.

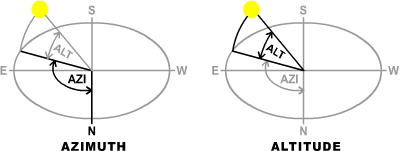
Here are the definitions of azimuth and altitude for a ground observer.


Obliquity of the Earth orbit


From a ground perspective the sun travels throughout the sky on a circle called the ecliptic. If we call celestial equator is the projection of the Earth equator on the celestial sphere, then the ecliptic is the circle obtained by tilting the celestial equator in the same way (direction and angle) as the Earth is tilted (23.45°) with respect to its orbital plane. The celestial equator and the ecliptic intersect on two points, which are called the vernal and autumnal points.

Precision: All objects in the sky are projected to the celestial sphere (with respect to the Earth center), the distant stars as well and the nearby sun (and the planets, etc). As a consequence, the point on the celestial sphere represents a direction, not a location. The stars and the vernal/autumnal points are considered fixed when we analyse the sun motion over the course of the year.

Thursday, November 22, 2012

Sun Motion 1: Sunset in Paris

A long time ago, before digital cameras at the end of the 20th century, on my first trip to the Americas, I was trekking Peru with a group of friends. After several weeks we were casually strolling around Lake Titicaca, near Puno, in the 'Temple of Fertility' (a pagan temple from before Christinization ) as I remember. We had spend the night with local people on the Island Amantani, had eaten sweet potatoes and were pretty relaxed, our young selves silently smiling and breathing in the high altitude air.  I was proud and happy to have travelled to the distant land of the Mysterious Cities of Gold, and seen so many wonders, like the Machu Picchu.

Then I had this strange thought of a TV advertisement that showed on French television at that time. It was about people drinking Schweppes to celebrate the day when the sun sets under the Arc de Triomphe, exactly in the axis of the Champs Elysees.

Then I wondered, hey is there such a day or is it just a special effect for the ad ? And I started to try and figure out what the direction of the sun is at sunset. I knew that this earth orbits around the sun almost on a circle. Not exactly but it is a very decent approximation. Also that the earth rotation axis is slightly tilted from the perpendicular to the orbit plane. Also that the earth goes around the sun in one year which is 365 days. Not exactly because there are leap years, but it is a decent approximation. And of course that it completes a full rotation around its axis in one day, which is 24 hours.

Next I tried to visualize the earth spinning on its axis and orbiting the sun, from the space perspective and from the point of view of a person standing on the ground, and to switch from one to the other.
Well it is more difficult than what is seems. After some time, I had almost a headache.

Fortunately, I was travelling with some clever people, and notably a very sharp mind. This guy is as intelligent as he is humble, which makes him a very pleasant conversation partner. So I told him about what was on my mind. Then ensued one of my best memories of this trip, and still stick in my mind today as a canonical example of a successful Socratic dialogue. New to the subject, without indication or prejudice, we gradually explored the geometry of the sun-earth system and turned the question (is there such a day ?) into another, much simpler, the answer to which would give the solution.

It might not seem very impressive but it felt fantastic to me at that time, as it was completely impromptu and we did it without pen and paper. Just bare sheer conversation. In the most ancient Greek fashion 
A glorious day, I tell you !!

As I remember now the reasoning was something like that:

  • The easiest point: Standing on the North Pole, the sun stays at the same altitude in the sky throughout the day. That altitude will change with the day of the year. Its highest point is EarthTilt°, reached on the summer solstice. Its lowest point is -EarthTilt°, reached on the winter solstice. In the latter case the altitude is below zero and the sun is  invisible.
  • Generalization: Wherever you stand on the planet, on a given day the angle from the earth axis to the sun is (quasi) constant. So the sun moves on a cone as seen from a ground observer, the axis of which is the earth axis. The angle of the cone depends only on the tilt of the earth so changes from 90°-EarthTilt° to 90°+EarthTilt° in the course of the year, from solstice to solstice. This is easier to realize at solar noon.
  • Locally the angle from the vertical to the earth axis is simply 90°-Latitude°, and it is tilted towards the North (for the Northern hemisphere, as all I say here).
  • On the summer solstice, the sun is high in the sky at noon, so the angle of the cone must be 90°-EarthTilt°.
  • So the question boils down to: For a plane (the ground) and a cone (the sun path seen from the observer on the ground) defined by its peak (the observer on the ground), its axis (tilted towards the North, the angle of which to the vertical is equal to 90°-Latitude°) and its angle varying between 90°-EarthTilt° and 90°+EarthTilt°, consider the intersection of this plane and this cone. It is generally 2 lines starting from the observer (they correspond to sunrise and sunset) which are symmetrically positioned relative to the North direction from the observer. But it can be empty (days/latitudes when/where the sun stays above of below the horizon the whole days, beyond the Arctic/Antarctic circles).

Wednesday, November 7, 2012

Nuclide Chart

One sunday morning in October, I woke up early to go to the Hopper exhibition in the Grand Palais, Paris with a friend. I wanted to see his paintings, some of them famous, even to those who do not know who he is. I like the contrast between the reassuring gentleness of the overview, and the crudeness (sometimes cruelty) of the details.


But the waiting time in the line was several hours, even though we arrived at the first hour ! So instead, we ended up in the Palais de La Découverte, next door. There it was blissfully empty, at this hour. This place is welcoming and designed for children, I think, even though many adults would learn a thing or two, or more, strolling along the corridors and reading the description panels, and watching the funny experiments on display. The good old planetarium is also very nice... But there is something peculiar about the atmosphere, something difficult to describe, an impression I rarely get..  It felt that I had traveled back in time. The inside of the Museum could have been exactly the same at any point in time from 40 years back to yesterday. I felt in a time warp !

Admittedly that is rather a good sign for a Museum, but I suspect I tend to identify sciences and technology, quite naturally in my view. In the latter field however, every concept, every item carries a very clear time stamp. In the Palais de La Découverte, on the contrary, it is late 19th - early 20th century science all over the place. This period in history is arguably one of most fertile in terms of scientific progress. It was breakthrough after breakthrough, in many disciplines. The human mind was furiously mapping Nature. And science was held in very high esteem, an unequivocal source of good. As the 20th century painfully rolled out, opinions gradually changed..

So I could not help thinking that the Museum would benefit from an upgrade and a strengthening of the connection between fundamental sciences and its applications. I would also use the vast real estate more efficiently, cram more presentations/experiments, systematically put the material on line too, and direct the visitor to related web sites, display the text in several languages (at the very least English), maybe even sublet a part of the Museum to technological/scientific companies/student bodies, if only to introduce some uncontrolled element in the place.

Now, I must be unfair to some of sections of the Museum. Surely they have some exhibitions in tune with the current zeitgeist  For example, there must be a section about climate change, a relatively new concern. There are some touch screens, but very few. Alternatively, one could defend the position that this dated atmosphere is completely intended, and must be carefully maintained. One could also point out that my suggestions are utopian, and that the Museum does very well with the budget. I would still think there is room for improvement.


In spite of all the remarks above, I enjoyed it very much. Especially the 'Atomic section'. I came across an enlightening short movie introducing the Nuclide Chart, the Valley of Stability, and basic radioactivity concepts, in no more than 5mn, and it was astonishingly clear !


Tuesday, October 16, 2012

Convolve n Square Pulses to Gaussian

The other day, I was perusing Wikipedia, and stumbled upon the convolution page.
Intrigued by the convolution of 2 square pulses, which is a triangular function, I set about convolving a square pulse with itself several times and soon empirically observed that it seems to converge to a Gaussian shape, and fast.

The graph below shows the result of such convolutions for n from 0 (initial square pulse) to 9.


After only 3 convolutions the resulting function is visually indistinguishable from a Gaussian shape.


Sunday, September 30, 2012

Snake Cube


Last December, a young cousin of mine got a snake cube for Christmas. He showed it to me. Even though I have never seen that thing, I took a low pitched voice, hinted with a lot of self confidence that it was very easy to do/undo it. In the manipulation, I unfolded it and... was completely unable to fold it again into its original cube shape. I was a little bit ridiculous  and later decided that at least there is a good way to turn this domestic defeat into a learning experience: I should solve this snake cube.. No ! All snake cubes !! Forever !!!  

Nothing difficult, of course, but the problem still requires to be approached in an organized fashion.

Introduction


A snake cube puzzle is a string of 27 cubes connected by an elastic that goes through each cube. The elastic goes either straight through the cube, from one face to the opposite, or turns inside the cube and goes from one face to an adjacent. The aim of the game is to fold it into a 3x3x3 cube, if possible. It is usually quite difficult to do it the first time, when a snake does not have many solutions.


Our objective here is to find all possible solution snake cubes (ignoring rotations and reflections), and sort them to try and make sense of how this population is distributed. To be more specific, any 2 snakes that are identical after a series of rotations and/or reflections are considered one solution.

A solution snake cube is an undirected Hamiltonian path in the 3x3x3 grid graph.

In order to explore the possibilities in an orderly and economical way, we first describe a method to travel inside the grid graph, starting from specific first few vertices all the way to Hamiltonian path. We try to avoid doing redundant searches. Indeed the cube has many symmetric axes, and many symmetric starting points. There are many possibilities to explore so this concern for optimisation is no luxury.

Once the search is complete, we sort the solution snake cube (the "paths") by letter sequence. A letter sequence is a string of 27 letters that define a snake cube puzzle.
  • E for and end cube.
  • S for a 'straight' cube; the elastic goes from one face to the opposite face.
  • C for a 'corner' cube; the elastic goes from one face to an adjacent face.

Within all the paths for one sequence, we determine the "base" paths, ie those which cannot be deducted one from the other by a combination of rotations and/or reflections ("transformations"). This step requires a lot of calculations so all transformation are computed beforehand. 

Finally we get all the base paths and can examine the results.


Monday, September 24, 2012

Poker 4: Monte Carlo Analysis

Why using Monte Carlo to compute poker probabilities ?
Because in a number of cases, the number of possibilities is way to large to be explored.

For example, computing the equity of on player's PreFlop hand that has NbOpp opponents sitting around the table requires to go through N different game configurations:
\[\left(
\begin{array}{c}
 52-2(\text{NbOpp}+1) \\
 5 \\
\end{array}
\right)\prod _{i=1}^{\text{NbOpp}} \left(
\begin{array}{c}
 52-2i \\
 2 \\
\end{array}
\right)\]
Even a very fast hand evaluator on a modern machine does not parse much more than 300 millions hands per second, which leaves the exact computation of a PreFlop hand equity for 4 or more players completely out of reach.

As cheesy as it may be, the table below helps visualizing the kind of numbers at play.


Naturally the numbers are meaningless past the 1 or 2 opponents case.
So computing the equity of PreFlop hand in the general case is practically impossible.
Let us turn to Monte Carlo simulations to at least approach these values.

Saturday, September 22, 2012

Poker 3: Exhaustive Analysis

There are 169 different possible PreFlop hands:
  • C(13,2) = 78 suited hands
  • C(13,2) = 78 offsuited hands, excluding pairs
  • 13 pairs

For a given such Pre Flop hand, let us generate all possible 5 table cards. There are C(50,5) = 2,118,760 different tables. Assuming each set of table cards is equally likely, i.e. neglecting the other players hole cards, we can compute the distribution of hand ranks associated to a PreFlop hand.

Sunday, August 26, 2012

Poker 2: Hand Evaluator

I am no poker player, but I know the basic rules (Texas Hold'em), having casually played one to one games against the computer on a friend's iPad. In the process I got interested in how the computer evaluates the strength of the hands as in quite a few cases an exhaustive enumeration of all possibilities is very long / impossible and in almost all cases a hand evaluator must be really fast to have any practical value...

So, perusing the internet, I ran into SpecialK's blog and was instantly admirative. His algorithm is so elegant, so simple, and therefore lightning fast, that the next time I blinked, I saw the allegory of speed and elegance combined... The glorious vision was something like this.


And it is so improbably fitting computers architecture (specifically 32 bit integers) that there is almost a divine touch to it...


Ok, after the emotion following the discovery, here is some information.